
Your Site Self Assesment Results
Performance Quadrant:
Missed Guidance
Site Capability Score:
Awareness
False positive trap:
Innocence
The productivity paradox in mining
It is easy to focus on the visible assets: the fleet, the plant, and the orebody. But these are just the hardware.
To get results, your site needs an operating system. The better the operating system, the better the results. We call this Operational Capability: the invisible engine that converts your strategy into cash flow.
For over two decades, the mining industry has been quietly facing a Productivity Paradox: despite massive investments in technology and equipment, productivity has fallen.
Why is this report valuable?
This is a diagnostic of your site's execution readiness. Based on your inputs, we have measured the 5 Fundamentals that determine whether you're likely to achieve your goals, and hit your targets.

The Invisible Engine
High-performance, and therefore, high value operations don't happen organically, or by accident. They are built deliberately on a structure of proven best practice.
The Operational Performance Framework(OPF) breaks this structure down into five distinct fundamentals. If one fundamental is weak, it threatens, and limits the entire organisation.
The operational performance framework
This section shows you how your site scored in each of the 5 Fundamental categories of the Operational Performance Framework. Ideally, your site should score 60% or above.
A low score isn't necessarily bad news. It means small changes will have an outsized impact.
It's a great way to visualise where to focus your attention and where there may be low-hanging fruit.
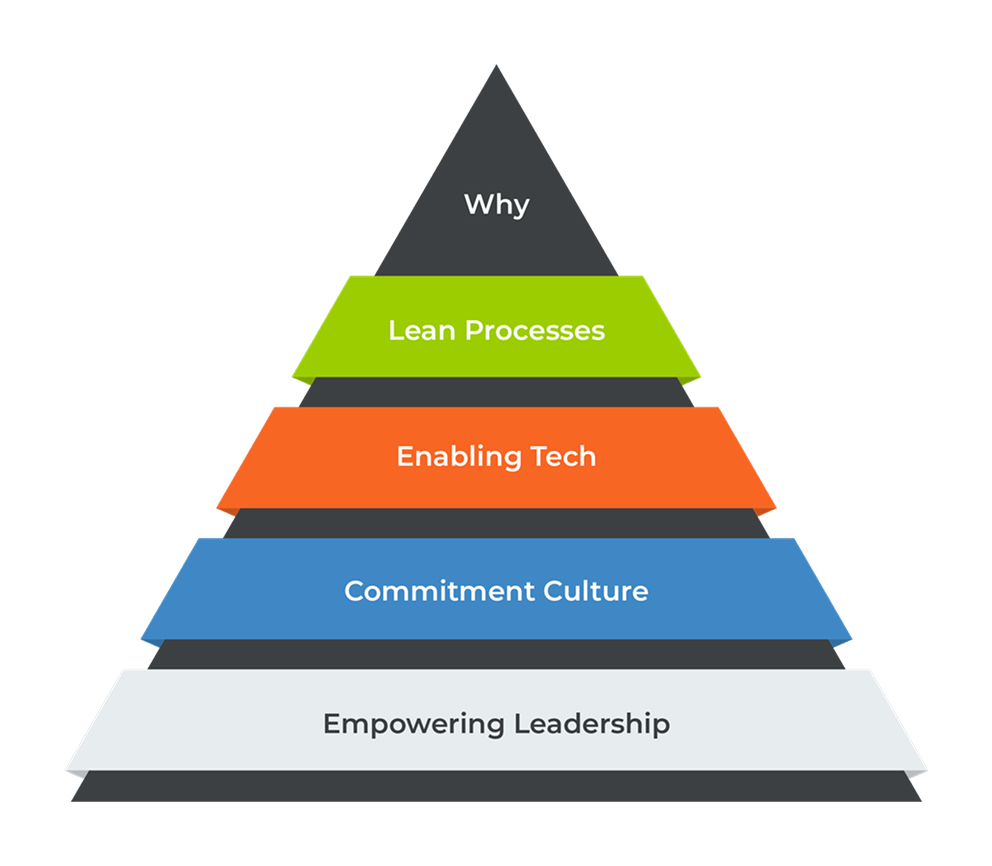
The five fundamentals
Fundamental:
Your score:
A compelling why
0
/100
Definition: This is the strategic alignment of the organisation. It goes beyond a poster on the wall; it is the shared understanding of why we are here, where we are going, and how we create value beyond just digging dirt.
Why it matters: Without a Compelling Why, a site ends up with “Clock Punchers”. These are employees who do the bare minimum because they don't see how their role contributes to the bigger picture. This forces leaders to micromanage every task.
How to improve your score
1. Establish Line of Sight: Ensure every operator can explain how their daily task (e.g., keeping the crusher fed) impacts the site’s long-term survival and strategy.
2. Move Beyond Lagging Indicators: If you only talk about yesterday’s tonnes, you are driving by the rearview mirror. Start measuring and celebrating Leading Indicators that predict future success.
3. Connect Values to Action: Don't just list values. Define the specific behaviours that demonstrate them. If safety is a value, you can't punish someone for downtime because the operation was unsafe.
Lean processes
45
/100
Definition: The systematic elimination of waste (waiting, rework, movement) to create a stable, predictable flow of value. It turns chaos into a repeatable system that doesn't rely on individual heroics.
Why it matters: Stability is the prerequisite for speed and scale. Many sites confuse “busyness” with “productivity”. This creates “operational debt” that leads to breakdowns, burnout, declining productivity, and missed targets.
How to improve your score
1. Make Waste Visible: You cannot fix what you cannot see. Start measuring “waiting time” as aggressively as you measure “uptime”.
2. Ensure Vertical Priorities: Align your Strategy, Tactics, Actions, Reviews, and Results (STARR). Ensure every meeting has a purpose and every plan has a review loop that all links back to the bigger picture.
3. Focus on Flow, Not Function: Don't optimise individual departments (silos) at the expense of the whole. Optimise the flow through the site.
Enabling tech
40
/100
Definition: Technology that simplifies work, accelerates outcomes, and provides a single source of truth. It should remove friction, and administrative burden by amplifying lean processes.
Why it matters: Most mines are drowning in data but starving for insights. If your morning meeting involves more than one data set for the same issue, you have a technology gap. No real-time, single source of truth paralyses decision-making, and obscures accountability.
How to improve your score
1. Process First, Tech Second: Never buy software to fix a broken process. It will just increase the chaos. Map the manual workflow first, optimise it, then add technology.
2. Establish a Single Source of Truth: Eliminate private data caches. Force all departments to work from a central database so you spend meetings solving problems, not arguing about reality.
3. Focus on the User: If a tool makes the operator's job harder, it will quickly become “shelf-ware”. Ensure tech reduces work, not adds to it.
Commitment culture
100
/100
Definition: Culture is how people act when they think no one is watching. A Commitment Culture is one where the workforce acts like owners, protecting the operation and seeking improvements without being asked.
Why it matters: A “compliance culture” does what it is told, but is administratively costly. Compliance is reactive, not proactive, so is often the hiding place of bad news. This creates the Iceberg of Ignorance, where 4% of front line issues are known to executives… until they become catastrophes.
How to improve your score
1. Foster Psychological Safety: Make it safe to speak up. If you shoot the messenger who brings bad news, you blind the organisation. Actively encourage the reporting of near-misses and process failures.
2. Co-Design Solutions: Stop imposing new rules from the top down. When an issue arises, ask the frontline to design the fix. They know the reality better than you do, and they will support what they help create.
3. Clarify “How We Work”: Define clear behavioural guidelines. Ambiguity breeds friction. Ensure everyone knows the “rules of the game”.
Empowering leadership
0
/100
Definition: The foundation of trust and accountability. It is the shift from “command and control” (telling people what to do) to “empowerment” (giving them the tools and authority to solve problems themselves).
Why it matters: The most common bottleneck in mining is leadership behaviour. If leaders act like “super-technicians” who jump in to fix every problem, they create a dependency culture. The site falls apart the moment the manager leaves.
How to improve your score
1. Delegate Authority, Not Just Tasks: Stop assigning “to-dos.” Assign outcomes and the authority to achieve them. Let your direct reports own the how.
2. Fix the System, Not the Person: When a mistake happens, resist the urge to blame the individual. Ask: “what in our system allowed this to happen?” This builds trust and encourages transparency.
3. Model the Behaviour: Leadership isn't what you say, it's what you tolerate. The standard you walk past is the standard you set.
From chaos to control
Each Fundamental contributes to a site's overall Operational Capability. This is the Invisible Engine that converts ambitious strategies into results.
Operational Capability is a measure of Organisational Maturity, and is fundamentally a predictor of Operational Performance.
The capability curve
0–20 (Innocence)
You don't know what you don't know. Operations are purely reactive.
21–40 (Awareness):
You know there is a problem, but you are stuck firefighting.
41–60 (Understanding):
You have some systems in place, but they are inconsistent.
61–80 (Capable):
Systems are working, and you are hitting targets reliably.
81–100 (Excellence):
You are demonstrating operational excellence.
The goal is
to move up this curve to Capable. Every step up reduces cost and improves performance.

An Inverse Relationship
Low Capability = High Friction: When systems are immature, friction is high. Every tonne moved requires disproportionate effort. Energy is wasted on rework, delays, and firefighting rather than production. Performance is chaotic and unpredictable.
High Capability = Low Friction: As capability matures, friction disappears. Systems handle the routine, and your people handle the exceptions. This creates Operational Leverage. The same input of effort generates significantly higher output.
The Hidden Tax
1. Predictability: The market pays a premium for certainty. High maturity sites hit their targets consistently, building trust with shareholders and stakeholders. Low maturity sites can be heavily penalised.
2. Cost Control: In the “turbulence zone,” sites are paying for chaos through expedited parts, overtime, and rework. Mature operations run leaner because they eliminate the waste of “waiting”.
3. Scalability: You cannot scale chaos. If you try to grow a low-maturity operation (e.g, through M&A or expansion), the inefficiencies scale as fast throughput. Maturity is the prerequisite for sustainable growth.
Execution risk
The Mine Performance Score (Capability) is only half the story. To understand the true operational reality, we must compare what your site can do (Capability) against what the organisation is trying to achieve (Strategic Ambition).
The Performance Quadrants visually maps the interaction between strategic ambition and site's ability to execute.
What does your future performance look like?
The Performance Quadrants

Your performance quadrant:
Missed Guidance
Low Capability / High Ambition You are aiming high but lack the engine to get there. You likely experience chronic firefighting, burnout, and are building an ‘operational debt’. You inconsistently hit targets through heroics, but it is not sustainable. The Fix: Focus entirely on stabilising the 5 Fundamentals.
* This is based on your capped capability score (below)
Next steps
Only you have the link to this page. Share this URL to share your results. This page is only available for 14 days, please print as PDF to save your results.